





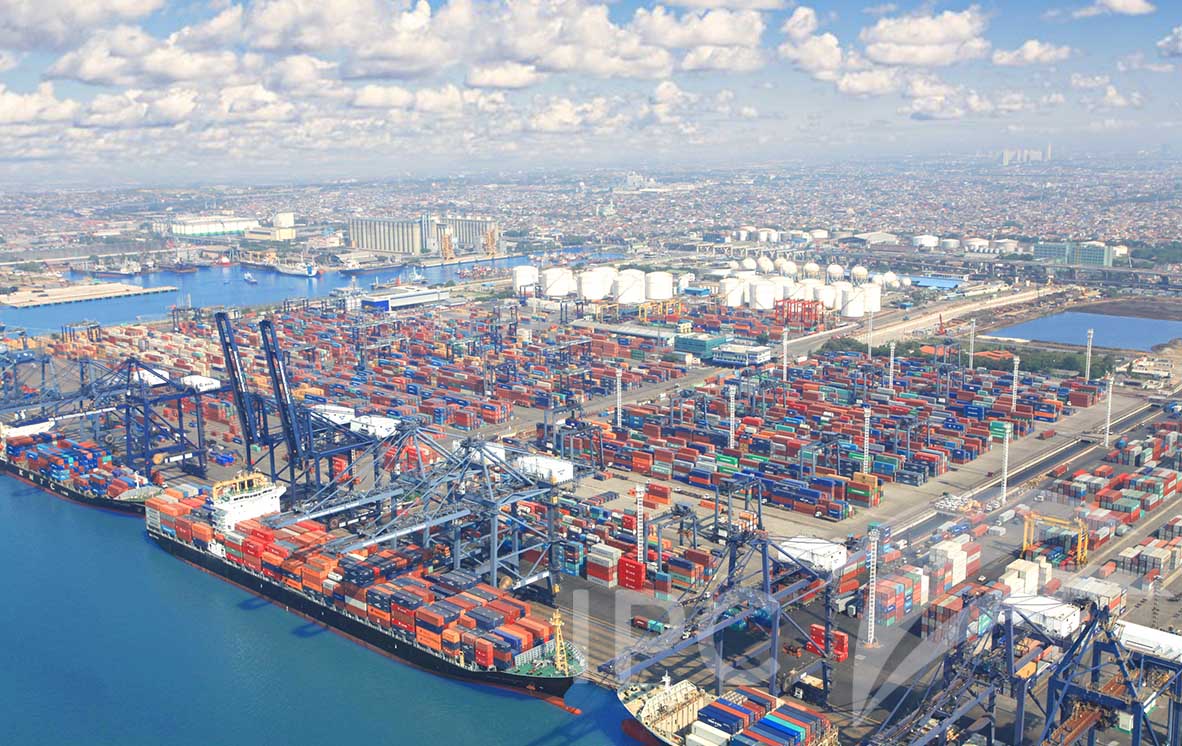
The Statistics Indonesia (BPS-Central Bureau of Statistics) announced that Indonesia’s December 2022 export value reached US$23.83 billion, down 1.10 percent compared to November 2022 exports. Compared to December 2021, the export value increased by 6.58 percent.
December 2022, non-oil and gas exports reached US$22.35 billion, down 2.73 percent compared to November 2022, while up 4.99 percent compared to December 2021 non-oil and gas exports.
Cumulatively, Indonesia’s export value from January to December 2022 reached US$291.98 billion, up 26.07 percent compared to the same period in 2021. Meanwhile, non-oil and gas exports reached US$275.96 billion, up 25.80 percent.
“The largest decrease in non-oil and gas exports in December 2022 compared to November 2022 occurred in mineral fuel commodities of US$483.1 million (9.44 percent), while the largest increase occurred in nickel and goods thereof of US$220.0 million (41.50 percent),” quoted from a BPS press statement on January 16, 2023.
Meanwhile, by sector, non-oil and gas exports from the processing industry from January to December 2022 rose 16.45 percent compared to the same period in 2021. Likewise, exports of agricultural, forestry, and fishery products rose 10.52 percent, and exports of mining and other products rose 71.22 percent.
The largest non-oil and gas export in December 2022 was to China, which amounted to US$5.79 billion, followed by Japan for US$2.08 billion and the United States for US$2.06 billion, with the contribution of the three of them reaching 44.39 percent. Meanwhile, exports to ASEAN and the European Union (27 countries) amounted to US$4.28 billion and US$1.64 billion, respectively.
Meanwhile, according to the province of origin of goods, Indonesia’s largest exports in January-December 2022 came from West Java with a value of US$38.59 billion (13.22 percent), followed by East Kalimantan with US$36.46 billion (12.49 percent) and East Java. US$24.75 billion (8.48 percent).
IMPORT
Meanwhile, Indonesia’s import value in December 2022 reached US$19.94 billion, up 5.16 percent compared to November 2022 or down 6.61 percent compared to December 2021.
Oil and gas imports in December 2022 were valued at US$3.20 billion, up 14.15 percent compared to November 2022 or down 5.23 percent compared to December 2021.
Non-oil and gas imports in December 2022 were valued at US$16.74 billion, up 3.60 percent compared to November 2022 or down 6.87 percent compared to December 2021.
The biggest increase in imports of non-oil and gas goods in December 2022 compared to November 2022 was cereals worth US$178.8 million (66.03 percent). Meanwhile, the biggest decline was plastic and plastic goods worth US$124.3 million (14.46 percent).
The three largest suppliers of non-oil and gas imported goods during January-December 2022 were China worth US$67.16 billion (34.07 percent), Japan worth US$17.08 billion (8.66 percent), and Thailand worth US$10.85 billion ( 5.50 percent). Non-oil and gas imports from ASEAN were valued at US$32.85 billion (16.67 percent), and the European Union were valued at US$11.63 billion (5.90 percent).
Meanwhile, according to the category of goods used, the value of imports from January to December 2022 compared to the same period the previous year saw an increase in the raw/auxiliary materials class of US$33,956.7 million (23.04 percent) and capital goods of US$7,727.6 million (26.99 percent), but consumer goods fell by US$350.5 million (1.74 percent).